Data
Here you can download the Western Creek stream and catchment shapes in a format that you can open with Google Maps, Google Earth or Geographical Information System (GIS) software such as ArcGIS. Please note that these are provided with no guarantee as to their accuracy, and they probably do not comply with ‘best practice’ in terms of how they have been compiled. They are the product of my rather rudimentary GIS skills, which are on display on the Methods page. They were produced with no other purpose in mind than the explorations that you see on this website, and they are provided here so that others may can explore them, or even better, improve them! If you do make any corrections or improvements, or if you create entirely new data and would like to share it, please send it to me and I will make it available here.
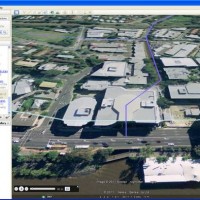
The flyover
To enjoy the flyover in Google Earth, follow these steps:- If you haven’t already done so, download and install Google Earth.
- Download and save these files: western_ck_main_stream.kml and western_ck_flyover.kmz.
- Open ‘western_ck_main_stream.kml’, either straight from Windows Explorer or from within Google Earth (go to ‘File’ then ‘Open’). The main stream should now appear on the map, and a corresponding entry should appear in the left-hand pane under ‘Temporary Places’. (If you like, you can skip this step if your browser gives you the option of opening the file in Google Earth rather than saving it on your computer.)
- In the same manner, open ‘western_ck_flyover.kmz’. Google Earth will probably launch straight into the tour. If it doesn’t, find and double-click the ‘Western Creek Flyover’ under Temporary Places. Using the controls that appear at the bottom-left of the screen (you may need to hover the cursor there first), you can pause, restart or track backwards and forwards through the tour.
Western Creek data
Here are all of the features that I created to depict Western Creek and its catchment, in both KML format (for use in Google Earth or Google Maps) and ESRI shapefiles (for use in ArcGIS or compatible GIS software). These are provided as is, with no guarantees or liability accepted whatsoever. You are free to use them for non-commercial purposes, provided they are attributed to this site.
- The catchment boundary – kml – shapefile
- The catchment boundary including sub-areas – kml – shapefile
- The trunk stream – kml – shapefile
- Secondary streams – kml – shapefile
- Tertiary streams – kml – shapefile
- The Milton section of the stream as per McKellar’s 1895 map – shapefile
- The 2011 floodline – kml – shapefile (note – this is derived from a dataset held by the Department of Environment and Resource Management, and available from the Queensland Government Information Service (QGIS))
How to load kml files in Google Maps
- Download and save the kml file (above) to your computer
- Open Google Maps in your browser
- Click on “My places”
- Click on “Create map”
- Click on “Import” and browse to the kml file in the location where you saved it in Step 1.
Base data
These are the ‘input’ and ‘background’ datasets that I used to generate the stream and catchment information, and to put it into context. The digital elevation model, catastral data, floodlines and flood imagery are all maintained by the Queensland Department of Environment and Resource Management, and can be downloaded (at no cost) from the Queensland Government Information Service (QGIS).
- South East Queensland digital elevation model (DEM). This DEM is based on a 25 metre grid covering the Burrum River, Mary River, Noosa River, Maroochy River, Pine River, Brisbane River, Logan-Albert River, Fraser Island, Stradbroke Islands, and South Coast Catchments.
- Brisbane local government area Cadastral dataset. This is a spatial representation of property boundaries and descriptions, extracted from the complete Queensland Digital Cadastral Database (DCDB).
- The January 2011 flood line for the whole of Queensland is available in ESRI shapefile format from QGIS.
- January 2011 flood imagery. These are high quality aerial photographs of affected suburbs taken during the 2011 flood. They are georeferenced and ready to load into GIS software.
- nearmap.com is a bit like Google Maps, but with far superior aerial photographs which are updated regularly. You can the most recent images as well as older ones. The images from the January 2011 flood are especially detailed. Unfortunately you can not download the images, but with some effort you can capture and stitch together screeshots which can then be geo-referenced in GIS software.
- Google Maps is another convenient source of aerial/satellite imagery. The downside, again, is that you can’t download the images. The upside is that Google Maps enables you to upload and view your own spatial data in kml format.
Last modified: March 6, 2012


48lgvl
w480v1
rr0mh8
yfwryw
3bo5p9
k1j956
n5j73u
sreqj1
7wyraj
e5inel