The catchments of the Crescent Reach

This post was updated on 24 May 2013 to include a revised outline of Langsville Creek catchment.

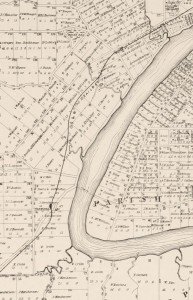
The Milton/Toowong Reach of the Brisbane River, depicted on a map from 1884.

The Milton/Toowong Reach of the Brisbane River, depicted on a map published in 1884

One of the first things I did when I created this website was to map out the catchment of Western Creek. While Western Creek has remained my focus, I have increasingly spent time thinking and writing about its neighbouring catchments as well, especially its three ‘sister’ catchments along what John Oxley called the Crescent Reach: Boundary Creek, Langsville Creek and Toowong Creek. These creeks are visible in several old maps, such as the one shown to the right, which dates from 1884.1

I figured that it was about time to put these other catchments onto a map. So, I fired up ArcMap, fed it some digital elevation data and eventually coaxed out of it the catchment boundaries. And of course, I then loaded them into Google Earth. The image below shows, from left to right, the catchments of Toowong Creek, Langsville Creek, Western Creek and Boundary Creek. (I haven’t mapped out the streams of the other catchments — that can wait for another day.)
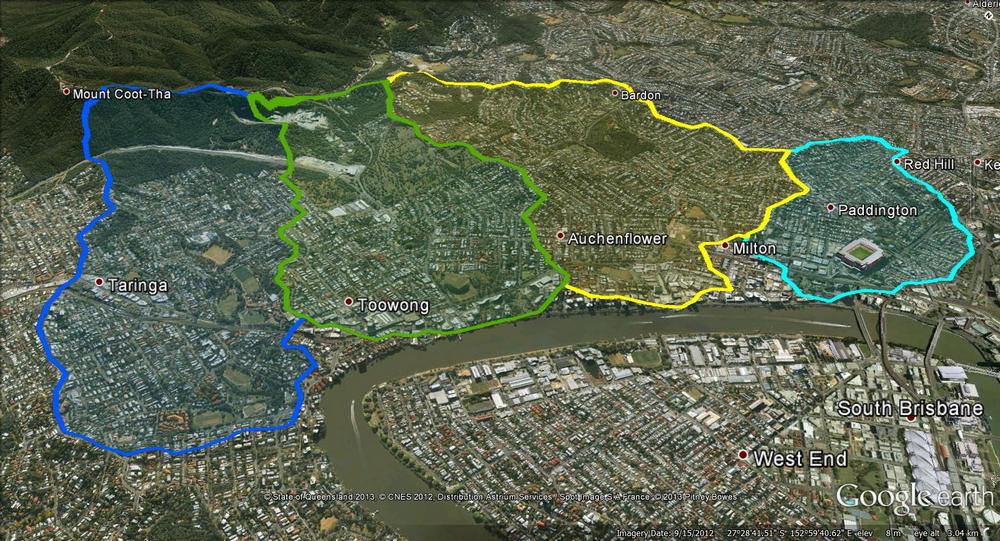
The catchments of the Crescent Reach. From left to right: Toowong Creek, Langsville Creek, Western Creek and Boundary Creek.

The catchments of the Crescent Reach. From left to right: Toowong Creek, Langsville Creek, Western Creek and Boundary Creek.

The precision of these boundaries is limited by the data used to create them, and you can tell by their jagged shapes that they are only approximations. Defining these boundaries can get particularly tricky as you get closer to the river, where the terrain is relatively flat.

But these boundaries don’t have to be perfect in order to be useful. The most interesting thing that they convey is the overall shape and size of the four catchments. At a glance, we can see that Boundary Creek is the smallest, while Toowong Creek and Western Creek are the largest. Using my GIS software, I calculated the catchment areas as follows:

Western Creek: 4.1 km2
Toowong Creek: 3.9 km2
Langsville Creek: 3.3 km2
Boundary Creek: 1.5 km2

I was surprised to discover that the Toowong Creek and Western Creek catchments are about the same size. I had always assumed that Toowong Creek was larger, and that this might be one reason why it (mostly) survived while Western Creek was (mostly) obliterated. But since their catchments are about the same size, their streams (at least in the lower reaches) should also have been comparable. Does this mean that we can use Toowong Creek as a reference point to tell us what Western Creek might have been like? Maybe, maybe not, as I suspect you would have to account for any notable differences in the geology, vegetation, topography and overall shape of the two catchments first. It is an interesting prospect, though.

Over the hill and far away

All four of these catchments share their uppermost boundaries with another catchment: that of Ithaca Creek. Ithaca Creek begins in the slopes of Mount Coot-tha and flows through Bardon, Ashgrove and Red Hill, where it meets its ‘parent’ stream, Enoggera Creek. The catchments of Ithaca Creek and Enoggera Creek are both shown in the image below, along with the four catchments of the Crescent Reach.
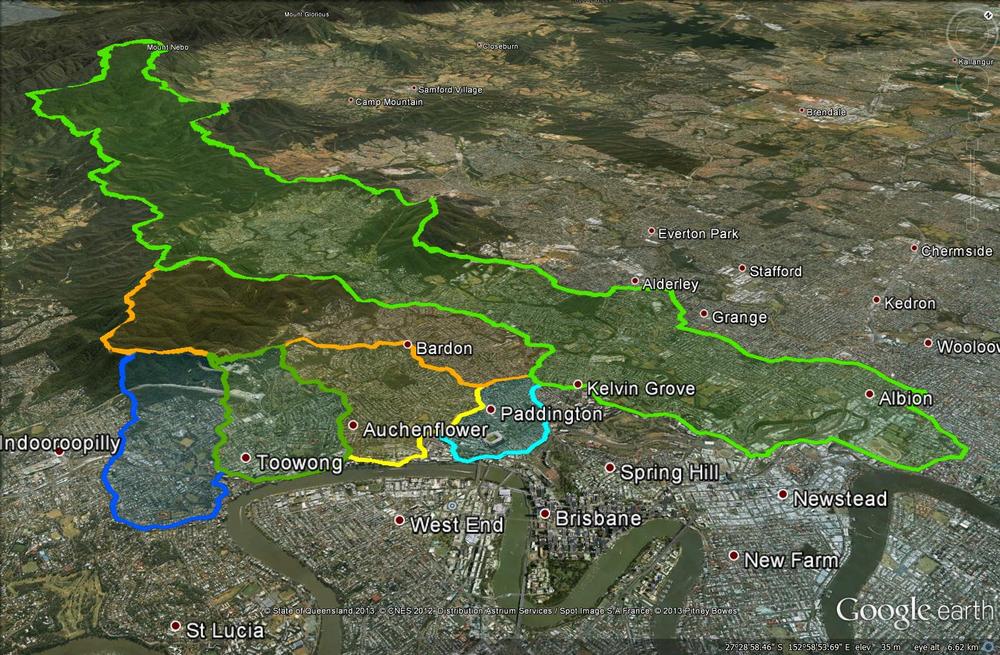
The four catchments of the Crescent Reach along with the larger catchments of Ithaca Creek and Enoggera Creek.

The four catchments of the Crescent Reach along with the larger catchments of Ithaca Creek and Enoggera Creek.

Ithaca Creek’s catchment covers an area of 11 km2 — almost as much as the four Crescent Reach catchments combined. But it too is dwarfed by the catchment of Enoggera Creek, which covers about 76 km2 (including Ithaca Creek, which is one of its tributaries) and extends all the way up through The Gap and into the D’Aguilar Range. No wonder Enoggera Creek was chosen to provide Brisbane’s first large-scale water supply.

And the rest of Brisbane? It could be mapped like this, too. In fact, I’d be surprised if the council hasn’t done it already, since these same catchments would delineate the networks of sewers and stormwater drains that the council maintains. And of course, where notable creeks still exist, their catchments will have been mapped to support monitoring and management initiatives such as Healthy Waterways. I hope that at some stage, this information will be made available for people to explore through Google Earth or similar platforms.

For now, you’ll have to make do with the six catchments I’ve discussed above. If you have installed Google Earth, then you can explore them yourself by opening (or downloading then opening) this file.

Notes:

  1. This map was produced by the Surveyor General’s Office in 1884. It is called ‘Moreton 20 chains to an inch, Sheet 1B’. It is held by the National Library of Australia, and is avaialble via Trove.

The Waters of Milton

I’ve expressed previously my enthusiasm for old maps. The older they are, the more they tend to reveal about the original landscape.

Until recently, the oldest map that I had found of the Milton area dated back to 1859. That map (‘Plan of Portions 203 to 257 in the Environs of Brisbane, Parish of Enoggera, County of Stanley, New South Wales) covers the area between Boundary Creek (which flowed between Cribb Street and Boomerang Street) and Toowong Creek. It depicts several features I had not seen on other maps, such as Red Jacket Swamp spilling over into Frew Park (later maps just show it covering Gregory Park) and a large lagoon between Cribb Street and Park Road.

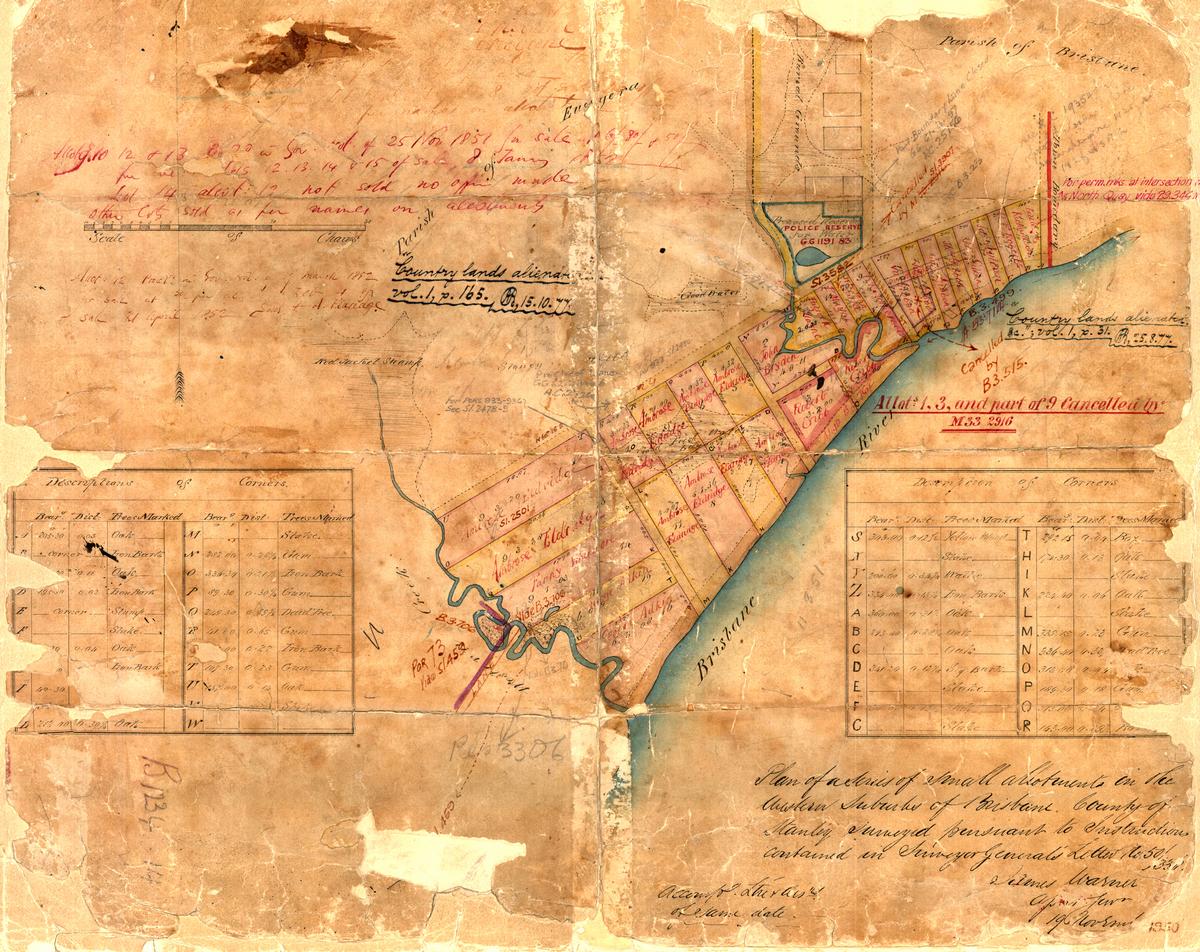
But now I have an even older one, courtesy of Magnus, who writes the blog ‘A House in Auchenflower‘. Magnus went digging in the Queensland Museum of Lands, Mapping and Surveying and struck gold in the form of the map you see below.

Surveyor James Warner's plan of the Milton area in 1850, held by the Queensland Museum of Lands, Mapping and Surveying (B1234 14).

Surveyor James Warner’s plan of the Milton area in 1850, held by the Queensland Museum of Lands, Mapping and Surveying (B1234 14).

This map looks old enough to have fallen off a pirate ship. The various annotations on it show that it has been used and re-used for various purposes, and at different times, but the original drawing appears to date from 1850, when the assistant surveyor-general, James Warner, surveyed the area. Warner’s description of the map appears at the bottom-right corner: Continue reading

When waters collide

Just over a week ago I posted about the ‘tidal limits’ of Milton Drain, noting that at a very high tide, the drain is pretty much full to the brim.

Today, I braved weather that ranged between miserable and awful in order to see how the drain held up when it had more than just a high tide to contend with. With the remnants of Cyclone Oswald looming over South East Queensland, Seqwater began releasing water from Wivenhoe Dam on Friday evening, and according to the Seqwater website, the releases are expected to continue for several days. So we have the tides coming in from downstream, the dam releases coming from upstream, and the stormwater from the Western Creek catchment racing through the drains towards the river. What happens when the waters collide?
Continue reading

Floods aniversary special

Two years ago today, Rosalie and many other parts of Brisbane were underwater. Any misconceptions we had about the power of Wivenhoe Dam to save us from ever being flooded again were swept away, and before long, attention turned to what, if anything, we could do to stop this from happening again.

In a post in The Forum (actually the first!), a visitor named Barry noted that the Council plans to install a floodgate at the mouth of Western Creek (Milton Drain) to mitigate future flooding in Milton and Auchenflower. As in many other parts of Brisbane in January 2011, the floodwaters that inundated the Western Creek catchment did not spill over the riverbanks, but entered instead via the stormwater drains that discharge to the river. The diagram below, taken from the Council’s fact sheet on backflow flooding, illustrates how this kind of flooding occurs.

Concept diagram of backflow flooding, taken from the Brisbane City Council's <a href="http://www.brisbane.qld.gov.au/downloads/environment_waste/water/Backflow%20Fact%20Sheet%20June%202012.pdf">factsheet</a>.

Concept diagram of backflow flooding, taken from the Brisbane City Council’s factsheet.

The Council has indeed stepped up to the plate and has already started building backflow prevention devices in Milton and elsewhere. And among the areas that have been flagged for future attention is the mouth of Western Creek.

This is a laudable idea, but the Council can hardly claim credit for it. The idea of using floodgates to protect Milton and Rosalie has been doing the rounds for over a century. In a new page entitled Backflow to the Future, or: How we learned to stop worrying and love the floods, I present a retrospective of these past proposals, courtesy of newspaper clippings from The Brisbane Courier and The Courier Mail that I have found while trawling through Trove.

The title of the essay is strictly tongue-in-cheek, and I’ll admit, downright cheeky. I’m not suggesting for a minute that we really enjoy the floods, and I don’t want to offend anyone who has suffered from them. But I do hope to put into stark focus the question of why, after all these years, we have not adopted such simple measures as floodgates to ease the pain. And I confess, the temptation to structure an essay around Dr Strangelove was just too much for me to resist.

I hope you enjoy the new page. It has been a fascinating journey to write.

-Angus

Picturing the past

If a picture says a thousand words, then today’s post should more than compensate for the lack of writing that I’ve done in recent weeks.

For a while now I have been collecting any historical photographs I can find of The Western Creek catchment and surrounding area. So far these are limited to those that have already been catalogued and digitised by the State Library of Queensland, the Queensland State Archives, the Brisbane City Council and the National Library of Australia. I like to think that there are still some more old photos out there, waiting to be dusted off and contributed to collections like these.

Rather than just post the photos I’ve collected into a standard gallery, I’ve done my best to determine where they were taken so that they can be put onto a map. The resulting map will live on this page under The Gallery, but the smaller version below provides a sneak-peak. You can navigate the map and click on the photos to view them.


View Western Creek History in a larger map

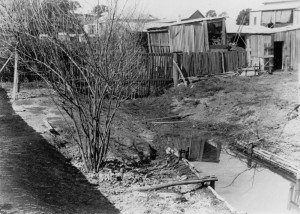
An open drain in a backyard at Ellena Street, c1905. (State Library of Queensland, Image no. 47486)

An open drain in a backyard at Ellena Street, c1905. (State Library of Queensland, Image no. 47486)

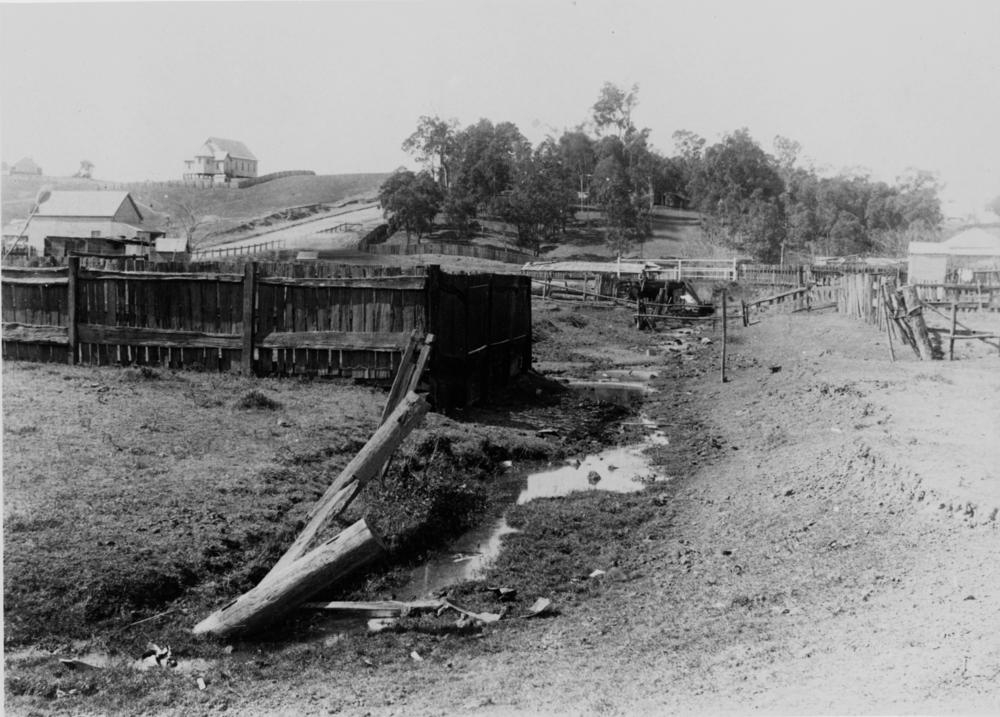
Among the highlights is the photo below from 1905, which shows a very sad and sorry looking creek bed flowing (according to the original caption) between Fernberg Road and Beck Street (then known as Mary Street). I suspect it was taken not far from Ellena Street, looking up towards Fernberg Road and Given Terrace. This creek bed could very well be the main channel of Western Creek. Another photo (see right) shows an open drain in a backyard in Ellena Street; I suspect this is also the main channel of Western Creek, just metres upstream of the other photo. Alternately, one or both photos could be of a tributary to the main channel. Whichever the case, these pictures neatly capture the fate of many waterways like Western Creek that stood in the path of early development. Besides these, I know of no other photos depicting the original channel of Western Creek.

Old creek bed running between Fernberg Road and Mary Street, Paddington, ca. 1905. (State Library of Queensland, Negative no. 47487)

Old creek bed running between Fernberg Road and Mary Street, Paddington, ca. 1905. (State Library of Queensland, Negative no. 47487)

The Langsville Bridge at Auchenflower, ca. 1914. John Oxley Library, State Library of Queensland, Neg: 10579.

The Langsville Bridge at Auchenflower, ca. 1914. John Oxley Library, State Library of Queensland, Neg: 10579.

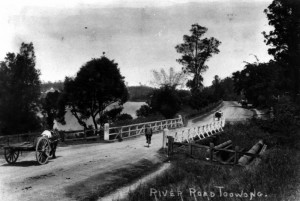
Also on the map are several photos of the River Road (Coronation Drive), including some of the bridge over Langsville Creek, which flowed through what is now Moorlands Park. Or perhaps some of these show the bridge over Western Creek instead — I confess that in some cases I am not sure, and I don’t trust some of the original captions either!

There are lots more that I could talk about, but instead I’ll leave you to explore the map yourself. If you spot a photo that you think is out of place, please let me know. And if you know of any photos that are not included, particularly from sources other than the ones I have used, I would love to see them.

Floods

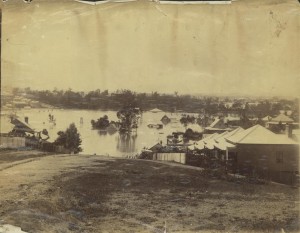
1893 flood taken from the Rosalie Torwood area looking towards old Bishopsbourne. (State Library of Queensland, Image number: 6288-0001-0001)

1893 flood taken from the Rosalie Torwood area looking towards old Bishopsbourne. (State Library of Queensland, Image number: 6288-0001-0001)

Not surprisingly, many of the surviving historical photos of this area were taken during floods, including those that occurred in 1890, 1893 and 1930. Several of these are on the map, but there are several others whose locations I have been unable to determine. I’ll make these the topic of a separate page or post in the near future.